Measurement essay · Published September 2, 2026
How I measure AI visibility
Imagine walking into a store with no aisles.
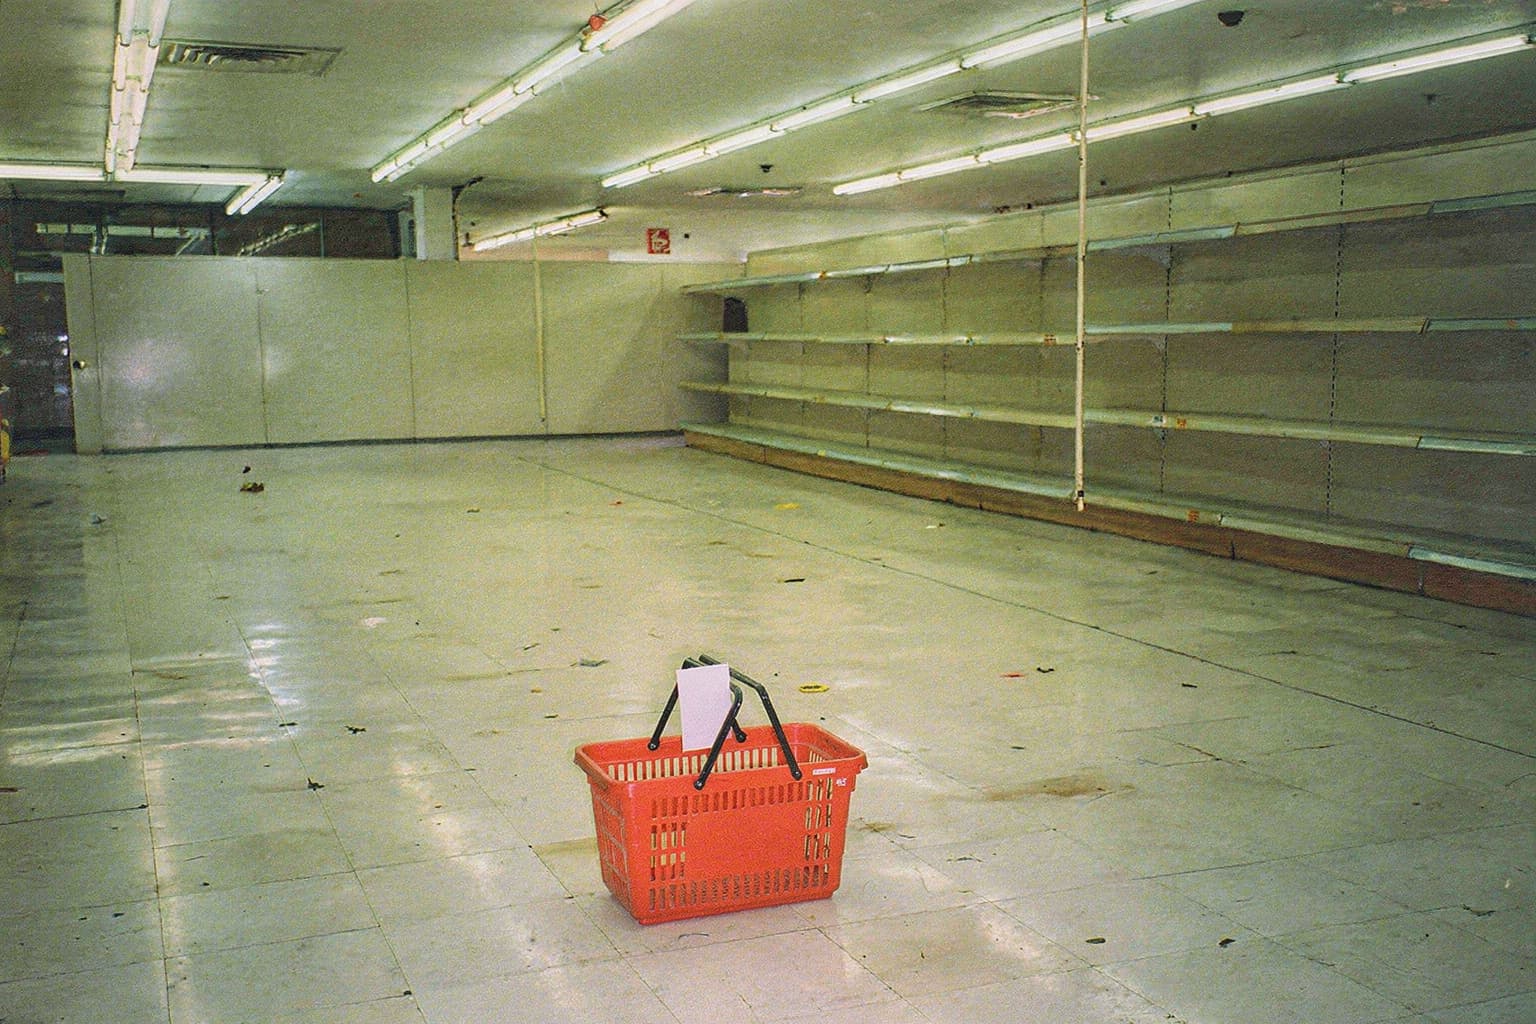
You ask for the best corporate card for a fifty-three-person software company that uses NetSuite and has a sales team that keeps expensing sushi at midnight.
Only then do the shelves roll across the floor.
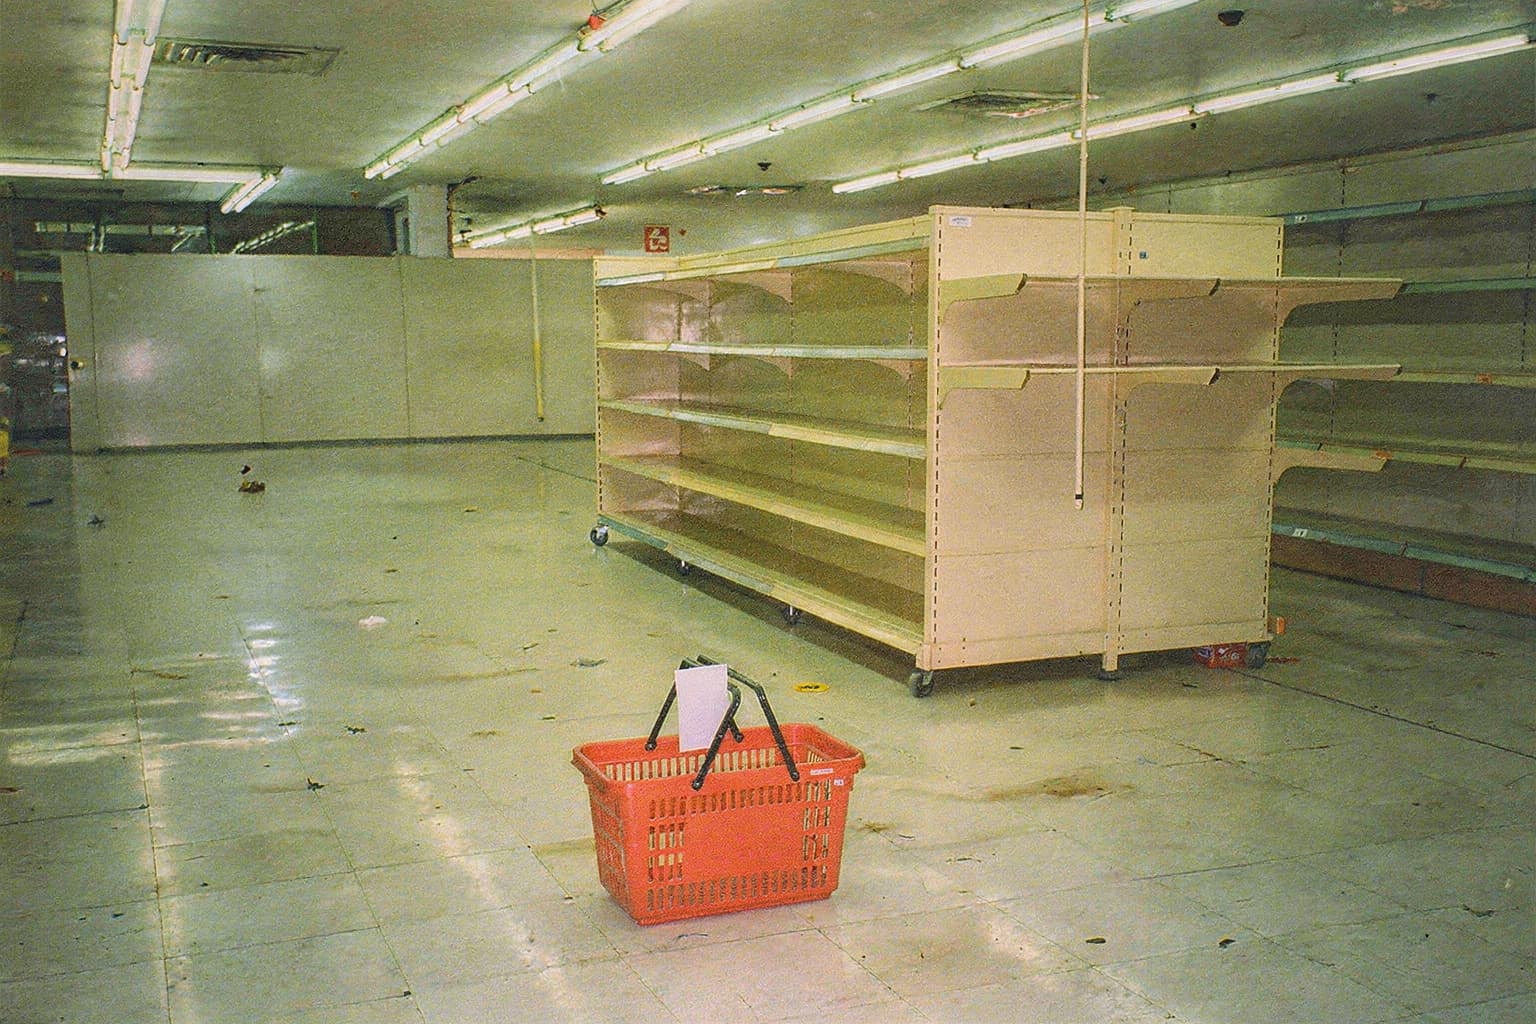

The store decides which brands belong.
The next customer asks a different question, so the store stocks a different answer.

In retail, the diagram that decides where every product belongs is called a planogram. It is a set of instructions for what the shelf needs to look like. Notably, it exists for all shoppers at the same time. There is one shelf. There is not my shelf and your shelf. There is the shelf.
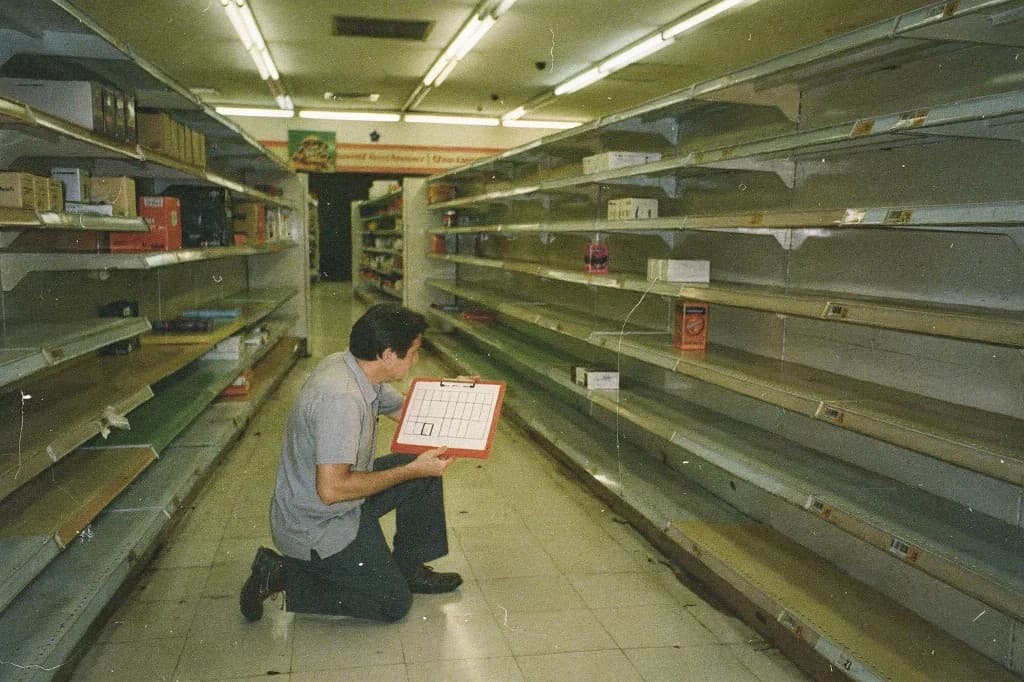
Search results behaved enough like a planogram to inherit the same measurement system. There was one list, its order was visible, and a brand could watch itself move from one position to another because the arrangement existed independently of the person looking at it. The query changed the aisle, but everybody who entered through the same query saw substantially the same shelf.
An answer engine has no planogram. Its shelves are built after the customer speaks, and no two customers are guaranteed the same aisle. Ask which expense platform can survive a CFO who hates software and a sales team that refuses to save receipts, and the engine has to decide what kind of store would answer that question before it can decide what belongs inside it.
It might build one shelf for accounting integrations, another for card controls, and a third for the stories finance teams tell after implementation. It chooses which brands belong, where to place them, which facts to print on the labels, and which outside sources to trust while assembling the display.
AI visibility lives inside these temporary aisles. There is no single shelf position that belongs to the brand, because the shelf is rebuilt for every question. What we call measurement is therefore a decision about which aisles to inspect, how often to inspect them, and what to record before they disappear. The dashboard can make this process look objective, but its most important decision happened before the first answer was generated: somebody chose the questions.

A survey of the wrong people gives the wrong answer.
Suppose a team wants to know how visible it is in AI search, and it begins with one hundred questions. Half concern buyers who already know the brand. Another quarter describe features the brand is unusually good at. The remaining questions cover the category more broadly.
The resulting visibility score may be measured perfectly, down to the last decimal, and still describe a market that no unbiased buyer ever enters.
This is why I usually begin with roughly twenty prompts that somebody on the team has read and can defend aloud. Twenty is not a law of statistics. It is simply small enough that every question can still have a reason for being there. The prompts can cover different buyers and moments of a decision without becoming so numerous that the panel acquires authority merely through size.
Brand names stay out of these visibility prompts. A question that already names the brand describes a warmer market, one in which the hardest part of discovery has already happened. If the purpose is to learn whether an unfamiliar buyer will ever encounter the brand, the question has to be asked as though the brand does not yet exist. Otherwise the dashboard flatters the team by measuring an easier problem.
A panel of five hundred generated prompts can look more rigorous than twenty chosen ones, but size cannot rescue a sample nobody understands. In practice it often does the opposite. The larger panel hides its assumptions more effectively, and the precision of its output persuades the team to act on a market that was invented by the prompt generator. I would rather defend a small honest panel than inherit a large mysterious one.
Once the aisles have been chosen, the simplest number is visibility score. If the brand appears in forty of one hundred answers, its visibility score is forty percent. The number tells us how often the store decided that the brand belonged on the shelf. This is useful, but it says nothing about whether the shelf was crowded, whether competitors appeared more often, or whether the entire category became easier for every brand to enter.

Imagine two months in which a brand's score rises from twenty percent to thirty percent. It seems to have gained ground. Now imagine that its three closest competitors moved from twenty-five percent to forty. The brand became more visible and less competitive at the same time. The score reports the first fact and conceals the second, even though the second is the one a buyer experiences.
Reverse the hypothetical. An engine changes the way it handles the category and visibility falls for everybody. The brand drops from forty percent to thirty, while its competitors fall far enough that the brand moves from fifth to second. A report centered on score describes a bad month. A report centered on visibility rank reveals that the brand has never been in a stronger competitive position.
This is why I read visibility rank first. Rank asks where the brand stands relative to the other brands appearing across the same panel. Score tells me how wide the lead or deficit is after I know the direction.
First place at seventy percent and first place at eight percent are plainly different situations, but they are both first place. The rank establishes the competitive truth; the score tells us how settled that truth has become.
A product can be stocked everywhere and still sit on the bottom shelf.
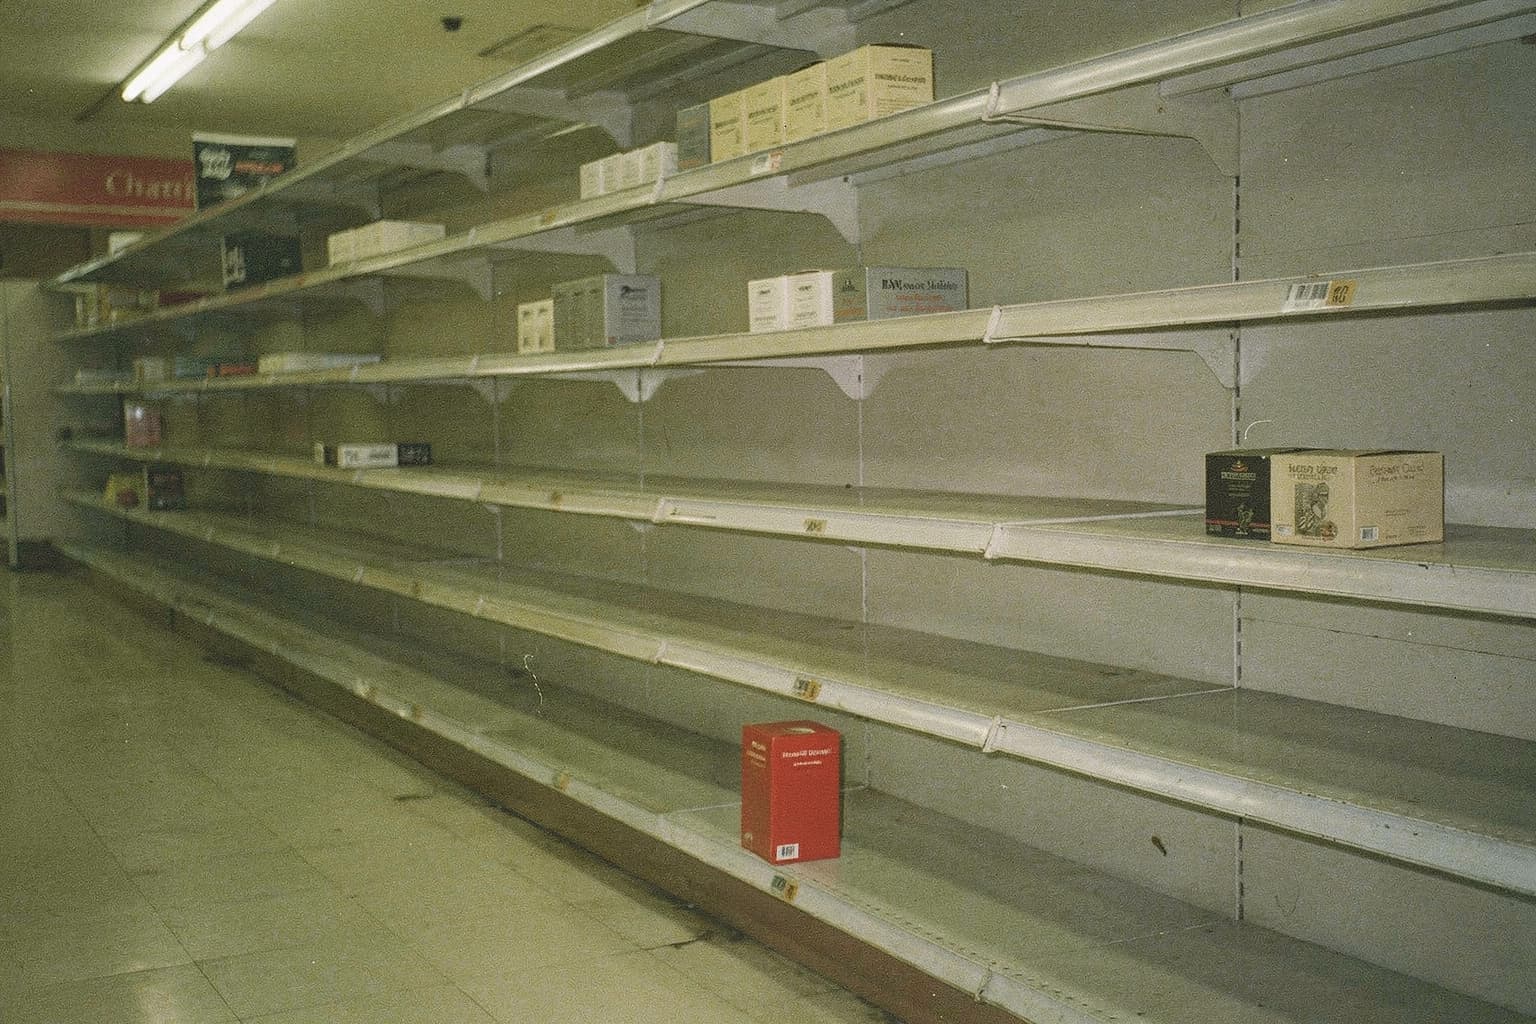
Consider a brand that appears in nine out of ten answers. A ninety-percent visibility score is impressive, and the brand may lead its competitive set. Yet suppose that whenever an answer presents an ordered list, the brand appears fifth. The store is willing to stock it everywhere but never places it within easy reach.
This is the work of position. Visibility rank compares brands across the whole panel; position records where a brand appears inside answers that arrange their recommendations in order. The distinction separates inclusion from preference. A brand can be broadly present without becoming the engine's first choice, just as a product can occupy every store in the country while remaining on the bottom shelf.
Some answers have no meaningful order, and I leave them outside the position calculation. Assigning a rank to an unordered paragraph would make the metric look tidier while making it less true. Measurement becomes more useful when it is allowed to admit that the underlying answer did not produce the fact we wanted to record.

The store also has to decide where its product information comes from. It may use the brand's website for specifications, a comparison article for context, and a Reddit thread for the judgments that neither source is willing to make. The answer presented to the buyer is assembled from this material, whether or not every source receives equal space in the final response.
Citation share measures influence over that assembly. If half of the observed citations point to a brand's owned pages, those pages supplied half of the visible source material used to construct the answers. The numerator can also be a competitor, a publisher, or an entire source class. The choice has to be named, because each version of citation share describes a different part of the answer's supply chain.
Imagine an airline with excellent visibility rank and almost no owned citation share. This need not be a problem. An airline is not likely to publish an impartial guide to the best airlines, and buyers would be right to distrust it if it did. Travel publications and customer forums may be the proper sources for the question, in which case low owned citation share tells us that the answer's supply chain is working as the category requires.
A different brand may have weak visibility rank while its documentation appears in nearly every answer. Here the engine trusts the company as a supplier of facts without treating it as a recommendation. The company does not need more citations; it needs to understand why trusted facts are failing to produce preference. The percentage identifies the pattern, but the explanation is found by opening the cited pages and reading which claims they support. Citation share becomes useful at the moment it sends the practitioner back to a source.
The label can still be wrong.
Suppose the brand leads on visibility rank, appears first in most ordered answers, and supplies a healthy share of the citations. The dashboard is entirely green. Now suppose the answer tells buyers that the product lacks a feature it has offered for a year, or quotes a price that no longer exists. None of the visibility metrics has failed. They faithfully report that the brand is present and preferred while saying nothing about whether the description is true.
Accuracy has to be measured against facts the company can verify. Product capabilities, current prices, locations, policies, and availability need a source of truth, followed by a record of what the engines got right and wrong. The errors are usually more useful than the resulting percentage. An aggregate accuracy score of eighty-three percent sounds reassuring; three incorrect claims about price or eligibility tell somebody what to fix on Monday.
This distinction also protects the diagnosis. A visibility problem may require a stronger source, while an accuracy problem may come from stale product data, inconsistent owned pages, or an outside publisher that has not caught up. Calling both of them content gaps erases the difference between becoming visible and becoming legible.

Our imaginary store becomes stranger still when we remember that there is more than one of it. ChatGPT operates one store, Claude another, and the Google products a collection of related stores with their own suppliers. A brand can occupy the front shelf in one and fail to appear in the next because each engine has access to a different source universe and makes different decisions about when to search.
In my analysis, Claude and ChatGPT shared only eight percent of their cited domains. Put less statistically, almost none of the names on one store's supplier list appeared on the other's. Averaging the stores into one market would conceal the reason the brand wins in one place and loses in another.
I therefore read visibility rank, score, position, citation share, and accuracy by engine before looking at any combined view. By the time the separate readings make sense, the combined number is rarely the thing that guides the work. It is a caption for executives, not the diagnosis.
Asking ten people the same question 100 times is still a survey of ten people.
This difference helps with the question of how often to run a prompt. Imagine a panel with ten questions. Running each question one hundred times gives a very deep reading of ten narrow aisles. Expanding the panel to one hundred questions opens more of the store, though each aisle is observed less often. Neither approach is automatically better. The right choice depends on whether the uncertainty lies inside each answer or in the range of markets the panel has failed to include.
Jennifer Zou tested part of this tradeoff at Profound by running the same 753 prompts across seven US platforms for two weeks. One setup ran each prompt once per day, while the other ran it ten times, producing roughly 989,000 executions and 6.66 million citation slots. Visibility score was 78.7% in the once-daily portfolio and 80.4% in the ten-run portfolio. Citation share was 10.24% and 9.99%. The full run-frequency study includes the portfolio analysis.
The result suggests that a sufficiently broad portfolio performs a great deal of averaging on its own. More repetitions can tighten the reading of an individual prompt, particularly for citations, but they cannot repair a panel made from the wrong questions. The study's resampled portfolios found that prompt composition mattered especially for citation share. I would spend effort defending the sample before spending it on another ninety-nine runs of a question that does not represent the buyer.
There is also a limit no number of repetitions overcomes. The models, indexes, and products change, so part of the movement belongs to the engine rather than the brand. A stable panel helps separate those two possibilities. It cannot make the engine stand still.

One last hypothetical reveals what the dashboard cannot measure. A buyer spends twenty minutes asking ChatGPT about a problem, encounters a brand as part of the answer, closes the conversation, searches the brand's name on Google, and buys from the website. The analytics system credits Google because Google delivered the click. The answer engine did much of the persuasion, yet it disappears from the attribution record.
Referral traffic remains worth recording, but it describes the narrow group of people who click directly from an answer. The broader influence is often recovered through a much less sophisticated instrument: a field on the checkout or demo form asking how the buyer heard about the company, with ChatGPT listed among the possible answers. Self-reported attribution is untidy, but the underlying journey is untidy. A clean number can be less honest than a messy answer when the clean number excludes the part of the journey that mattered.
The store was only a device, but it leaves behind a useful discipline. Begin with the aisles the buyer might plausibly ask the engine to build. Read rank before score so movement in the store is not confused with movement of the brand. Use position to separate presence from preference. Follow citations back through the answer's supply chain, and compare the labels with the facts the company knows to be true.
None of this produces one perfect action. It produces a clearer range of good ones: improve the page that should be supplying the answer, publish something for a buyer the site has ignored, correct the facts the engine keeps getting wrong, or earn a place in the source already shaping the recommendation. The value of measurement is that the marketer can see why any one of these might work and choose the one the organization can carry out.
This is the standard I now use for the dashboard. It should let a person travel from the number to the question, from the question to the answer, and from the answer to the sources that made it. When that path is visible, the analysis no longer asks the marketer to trust an expert's recommendation. It gives them enough of the mechanism to form their own conviction, which is far more durable. Confidence makes execution possible, execution produces evidence, and evidence earns the trust required for the next cycle.
The SAGE method is how I organize that cycle. The findings compendium keeps the samples and limitations attached to the underlying research, and the query fan-out reference follows the searches between a buyer's question and the sources an engine uses.